You can better understand why ditching fossil fuels is so important thanks to the Lawrence Livermore National Laboratory and its visual flow charts. They are also simple tools for debunking the myth of the transportation sector being much less polluting than the electricity generation sector. Let’s take a look at the last decade’s evolution of CO2 emissions based on the main sectors, and also on the types of fossil fuels.
First of all, let’s hear Big Oil’s ovations to the Biden Administration for recently greenlighting the Willow project in Alaska. ConocoPhillips estimates to produce 180,000 barrels of oil per day, which is 1.5% of total U.S. oil production.
The federal government will get between $8 billion to $17 billion (€7.5 billion to €16 billion) in revenue. I doubt that this money will support the Inflation Reduction Act subsidies, but you never know. In the meantime, experts estimate the oil from Willow will produce 263 million tons of greenhouse gases over its 30-year lifetime.
That’s the equivalent of the emissions of roughly 1.7 million ICE cars used over the same period. At least the U.S. Bureau of Land Management approved only three of the five drilling sites proposed by CoconoPhillips. So, things could have been a lot worse than this.
I made this introduction for you to see that the oil industry is doing all right and you should not fear the IRA will end its business-as-usual drilling for black gold. Why would it? It seems that the U.S. needs more of it, as the national fleet of vehicles is growing year by year.
The beauty of these flowcharts is you don’t have to be a scientist to understand them. They’re very easy to ‘read’ thanks to color codes. Based on information regarding each source of energy, you can see what amount of energy was used for each sector. Also, you can see the inefficiency of today’s energy use by Americans.
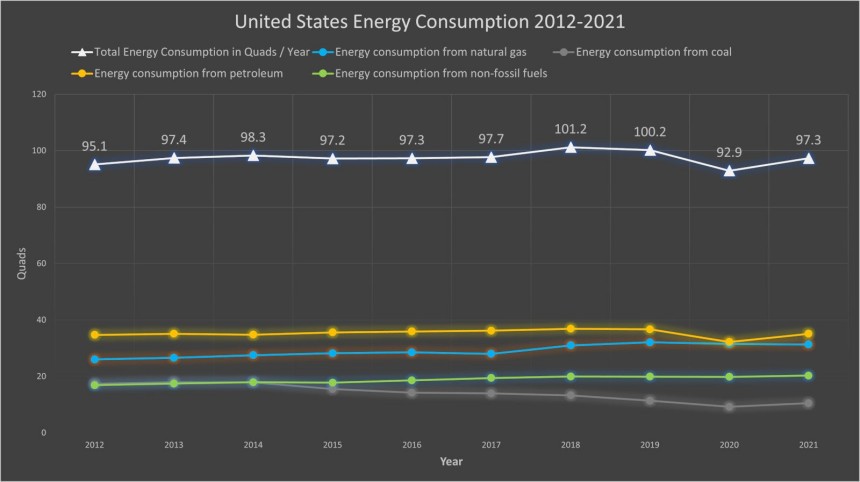
The total energy demand, in all its forms, is steadily rising and in 2018 it passed the 100 Quads mark. The drop in 2020 due to the pandemic was just a hiccup. In 2021 total energy demand raised by almost 5 quads compared to the previous year. This means in just one year the energy demand matched a 6-year raise, between 2012 and 2018.
If the pandemic hadn't happened, in 2021 the energy demand would have probably been close to 105 Quads. An average increase of one Quad per year in one decade is simply not consistent with the declared objectives of a net-zero economy by 2050.
That’s because the vast majority of energy consumption is fulfilled by fossil fuels. In the last decade, the combined share of petroleum, natural gas, and coal averaged 80.5%. The good news is that the share is decreasing. The bad news is that the decreasing rate is insignificant. The truth is America is simply locked in by the fossil fuels industry.
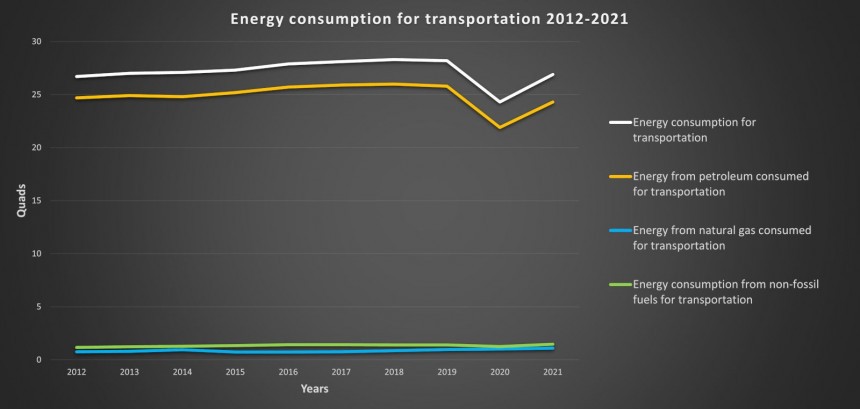
One thing you can see in the flowcharts is the transportation sector is 90% based on petroleum products. It’s the single sector ‘addicted’ to that degree to a single energy source. All the other sectors have many sources and none of them has more than 50% dominance.
One could argue that in the last decade, other forms of energy were on the rise in the transportation sector. This is true, based on trends. For instance, biomass, which is mostly biofuel, increased from 1.16 Quads in 2012 to 1.48 Quads in 2021. Natural gas also increased from 0.764 Quads to 1.1 Quads in the same period.
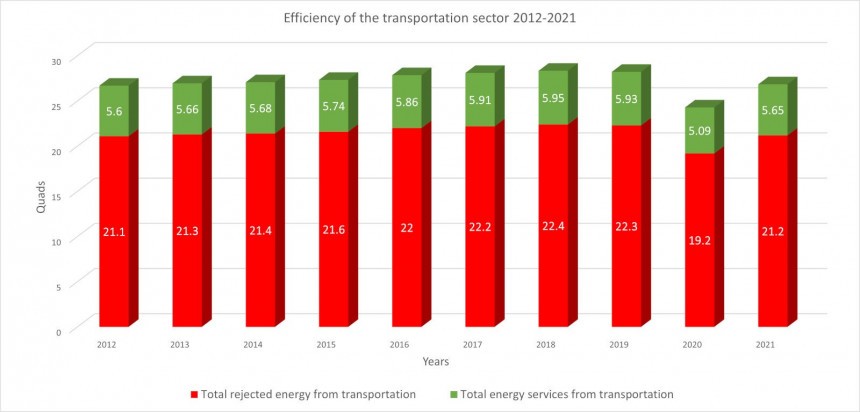
But when you compare these small values to the more than 20 times higher values of oil, they make no difference in the big picture. And what a grim picture that is! Because of the low efficiency of internal combustion engines, the transportation sector has the highest rejected energy share.
‘Rejected energy’ is how much of the energy used is wasted because of inefficient technologies. In the last decade, the transportation sector wasted on average 79% of the energy it used. By comparison, the electricity generation sector, dominated by natural gas and coal, has an almost 65% rejected energy.
If all those vehicles were EVs, the rejected energy would be four times smaller. And if electricity generation would ditch natural gas and coal, its rejected energy would be more than half smaller. This way, the transportation sector would be much, much more efficient.
In the bigger picture, inefficiency simply translates to high levels of emissions and pollution. And you can thank again the Lawrence Livermore National Laboratory’s experts because they also create energy-related CO2 emissions flowcharts.
Hold your applause, because the rate of decrease is simply not enough for America to reach its targets of net zero by mid-century. I can only hope the rate will strongly accelerate in the next years, but for now, I’m skeptical. And also intrigued.
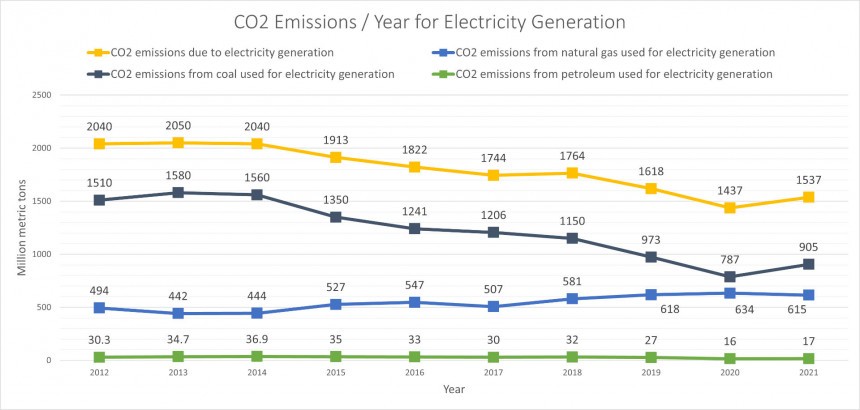
Electricity generation is the highest energy consumption sector, but the trend is slightly downward. The main reason is the steep decrease in coal usage, from almost 16 Quads in 2012 to less than 10 Quads in 2021. It was slowly replaced by natural gas, which grew from 9 Quads in 2012 to more than 11 Quads in 2021.
But the largest share in electricity generation comes from non-fossil fuel sources, and their values are bigger year-on-year. The most important so-called ‘non-fossil’ is nuclear, but solar, wind, and hydro have the greatest increase rate.
While the nuclear is around 8 Quads every year, the renewables trio grew from 4.28 Quads in 2012 to 7.11 Quads. They almost doubled in ten years, and we can thank mostly the wind industry. So, having more efficient energy sources leads to less energy consumption for electricity generation.
And consequently, the CO2 emissions trend is decreasing. In fact, between 2016 and 2017, electricity generation became less polluting than the transportation sector. From 2017 onward, petroleum-fueled vehicles’ CO2 emissions are higher than electricity generation. And unfortunately, the trend is showing an increase in emissions.
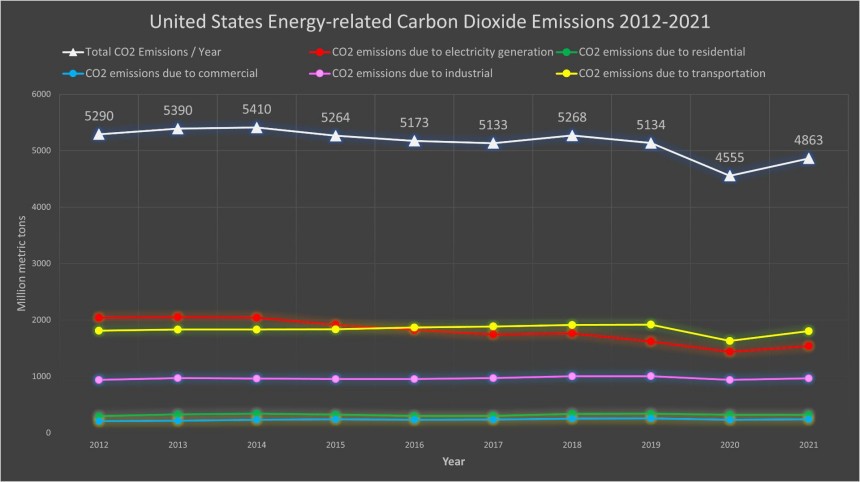
In 2012, CO2 emissions due to transportation were estimated at 1,810 million metric tons. Seven years later, in 2019, they were more than 1,900 million metric tons. In 2020 they dropped spectacularly, but in 2021 they recovered to the 2012 level. And in the next years, they are expected to pass the 2,000 million metric tons mark.
Why is that? You have one chance to guess. Petroleum, that’s right! More vehicles and more internal combustion engines mean only more CO2 emissions. Because the transportation sector is simply addicted to petroleum, 97% of the emissions are the result of burning gasoline and diesel in the engines.
As a result, in 2021 the transportation sector had the largest share in total CO2 emissions in the U.S., 37% compared to 31.6% for electricity generation. Overall, the petroleum used in all sectors is responsible for 45% of total CO2 emissions. And soon that percentage will get to 50%.
On the other hand, because of this inefficiency, the transportation sector has become the largest emitter of CO2 emissions in the U.S. in recent years. In the meantime, petroleum has the largest share of total CO2 emissions. And in the following years, its emissions level could become as high as coal and natural gas combined.
There’s no way any zero-emissions target could be achieved by relying on fossil fuels, especially petroleum products. Unfortunately, petroleum is very likely to remain the most used form of energy in the U.S. till the end of the 2020s, at least.
I wish I was wrong, but I suspect the Lawrence Livermore National Laboratory’s flow charts in the next years will prove me right. This year the agency will release 2022 flow charts and they will signal the trends in energy usage and emissions. I bet petroleum will be on the rise, both in Quads used and in CO2 emissions.
The federal government will get between $8 billion to $17 billion (€7.5 billion to €16 billion) in revenue. I doubt that this money will support the Inflation Reduction Act subsidies, but you never know. In the meantime, experts estimate the oil from Willow will produce 263 million tons of greenhouse gases over its 30-year lifetime.
That’s the equivalent of the emissions of roughly 1.7 million ICE cars used over the same period. At least the U.S. Bureau of Land Management approved only three of the five drilling sites proposed by CoconoPhillips. So, things could have been a lot worse than this.
I made this introduction for you to see that the oil industry is doing all right and you should not fear the IRA will end its business-as-usual drilling for black gold. Why would it? It seems that the U.S. needs more of it, as the national fleet of vehicles is growing year by year.
How much energy did the U.S. need between 2012 and 2021
The LLNL has a special methodology for transforming every type of energy into quads. ‘Quads’ stands for ‘quadrillion BTU’, where the BTU is a unit of measurement for energy, that can be transformed into kWh. This way you can easily compare different types of energy sources.The beauty of these flowcharts is you don’t have to be a scientist to understand them. They’re very easy to ‘read’ thanks to color codes. Based on information regarding each source of energy, you can see what amount of energy was used for each sector. Also, you can see the inefficiency of today’s energy use by Americans.
The total energy demand, in all its forms, is steadily rising and in 2018 it passed the 100 Quads mark. The drop in 2020 due to the pandemic was just a hiccup. In 2021 total energy demand raised by almost 5 quads compared to the previous year. This means in just one year the energy demand matched a 6-year raise, between 2012 and 2018.
That’s because the vast majority of energy consumption is fulfilled by fossil fuels. In the last decade, the combined share of petroleum, natural gas, and coal averaged 80.5%. The good news is that the share is decreasing. The bad news is that the decreasing rate is insignificant. The truth is America is simply locked in by the fossil fuels industry.
How much petroleum energy did the U.S. use between 2012 and 2021
Petroleum is the largest energy source used in the U.S., and its share is one-third of total energy consumption every year. In the last decade, the yearly energy values of petroleum steadily increased, because the nation’s ICE vehicles fleet is also getting bigger every year.One thing you can see in the flowcharts is the transportation sector is 90% based on petroleum products. It’s the single sector ‘addicted’ to that degree to a single energy source. All the other sectors have many sources and none of them has more than 50% dominance.
One could argue that in the last decade, other forms of energy were on the rise in the transportation sector. This is true, based on trends. For instance, biomass, which is mostly biofuel, increased from 1.16 Quads in 2012 to 1.48 Quads in 2021. Natural gas also increased from 0.764 Quads to 1.1 Quads in the same period.
But when you compare these small values to the more than 20 times higher values of oil, they make no difference in the big picture. And what a grim picture that is! Because of the low efficiency of internal combustion engines, the transportation sector has the highest rejected energy share.
If all those vehicles were EVs, the rejected energy would be four times smaller. And if electricity generation would ditch natural gas and coal, its rejected energy would be more than half smaller. This way, the transportation sector would be much, much more efficient.
In the bigger picture, inefficiency simply translates to high levels of emissions and pollution. And you can thank again the Lawrence Livermore National Laboratory’s experts because they also create energy-related CO2 emissions flowcharts.
How much CO2 emissions due to transportation were released into the atmosphere in the U.S. between 2012 and 2021
Contrary to energy consumption, the total CO2 emissions trend is showing a slight decrease over the last decade. After a spike in 2014, and then a steep drop in 2020, because of the pandemic, of course, in 2021 the official emissions level was less than 5,000 million metric tons.Hold your applause, because the rate of decrease is simply not enough for America to reach its targets of net zero by mid-century. I can only hope the rate will strongly accelerate in the next years, but for now, I’m skeptical. And also intrigued.
But the largest share in electricity generation comes from non-fossil fuel sources, and their values are bigger year-on-year. The most important so-called ‘non-fossil’ is nuclear, but solar, wind, and hydro have the greatest increase rate.
While the nuclear is around 8 Quads every year, the renewables trio grew from 4.28 Quads in 2012 to 7.11 Quads. They almost doubled in ten years, and we can thank mostly the wind industry. So, having more efficient energy sources leads to less energy consumption for electricity generation.
And consequently, the CO2 emissions trend is decreasing. In fact, between 2016 and 2017, electricity generation became less polluting than the transportation sector. From 2017 onward, petroleum-fueled vehicles’ CO2 emissions are higher than electricity generation. And unfortunately, the trend is showing an increase in emissions.
Why is that? You have one chance to guess. Petroleum, that’s right! More vehicles and more internal combustion engines mean only more CO2 emissions. Because the transportation sector is simply addicted to petroleum, 97% of the emissions are the result of burning gasoline and diesel in the engines.
As a result, in 2021 the transportation sector had the largest share in total CO2 emissions in the U.S., 37% compared to 31.6% for electricity generation. Overall, the petroleum used in all sectors is responsible for 45% of total CO2 emissions. And soon that percentage will get to 50%.
Sorry, petrolheads, but petroleum is the villain
Numbers have spoken, and they are straightforward. On one hand, petroleum is the most used form of energy in the U.S., and most of it is used in the transportation sector. Which has the largest share of rejected energy compared to the other sectors. Simply put, technology based on petroleum is the most inefficient.There’s no way any zero-emissions target could be achieved by relying on fossil fuels, especially petroleum products. Unfortunately, petroleum is very likely to remain the most used form of energy in the U.S. till the end of the 2020s, at least.
I wish I was wrong, but I suspect the Lawrence Livermore National Laboratory’s flow charts in the next years will prove me right. This year the agency will release 2022 flow charts and they will signal the trends in energy usage and emissions. I bet petroleum will be on the rise, both in Quads used and in CO2 emissions.


