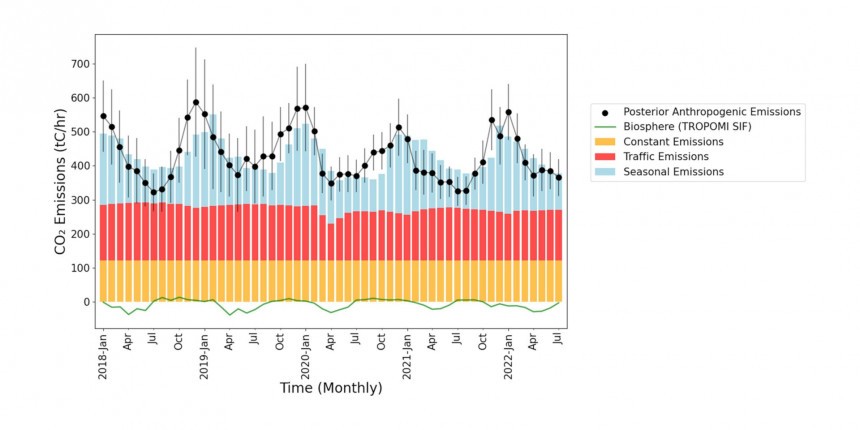
Captain Obvious must be proud: it took half a decade to actually measure CO2 emissions to conclude that "the interannual trend in urban CO2 emissions" decreased mainly due to passenger vehicle electrification. That's right, UC Berkley proved that it's feasible to quantify cars' emissions, apart from other sources.
Whether you are an EV enthusiast or a petrolhead EV detractor doesn't matter. Common sense should prevail: electric cars don't have a tailpipe, so they don't emit any pollutants or greenhouse gases from burning fossil-based fuels like gasoline or diesel.
Yes, you can blame an EV for its battery-related pollution, although this is an overinflated subject. And yes, you can blame electricity for being sourced from power plants running on dirty coal. Still, as the share of renewables is only growing day by day, the electricity carbon footprint is shrinking over time.
In the end, the only reason for electric cars' demise because of pollution-related issues is the idea that you can't blame solely internal combustion cars for the amount of CO2 emissions and all those nasty chemical polluters because you can't separate ICE vehicles' emissions from other sources, like industry, agriculture, cement production, and so on.
Well, UC Berkley just proved all naysayers that they're wrong. Because chemistry is a b*tch – in a positive way, that is.
EPA: "Monitoring emissions is expensive." UC Berkley's Cohen: "Hold my beer"
Cohen – where did I head that name? Of course, it was the singer and songwriter Leonard Cohen who made some impact in Western culture thanks to some of his best-known hits, like "Dance Me to the End of Love."
Unfortunately, Ronald Cohen will most likely remain in the shadows, although he deserves a movie like Oppenheimer. That's because Ronald Cohen, a UC Berkley chemistry professor, may have found a way for society (and honest politicians) to fight back against Big Oil's propaganda.
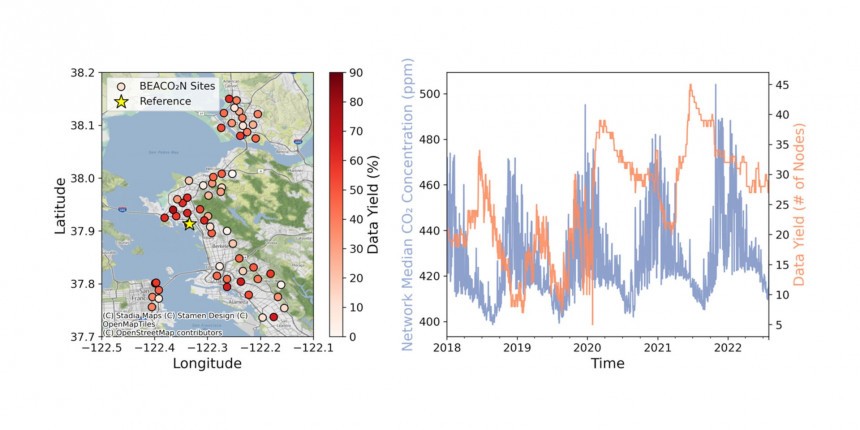
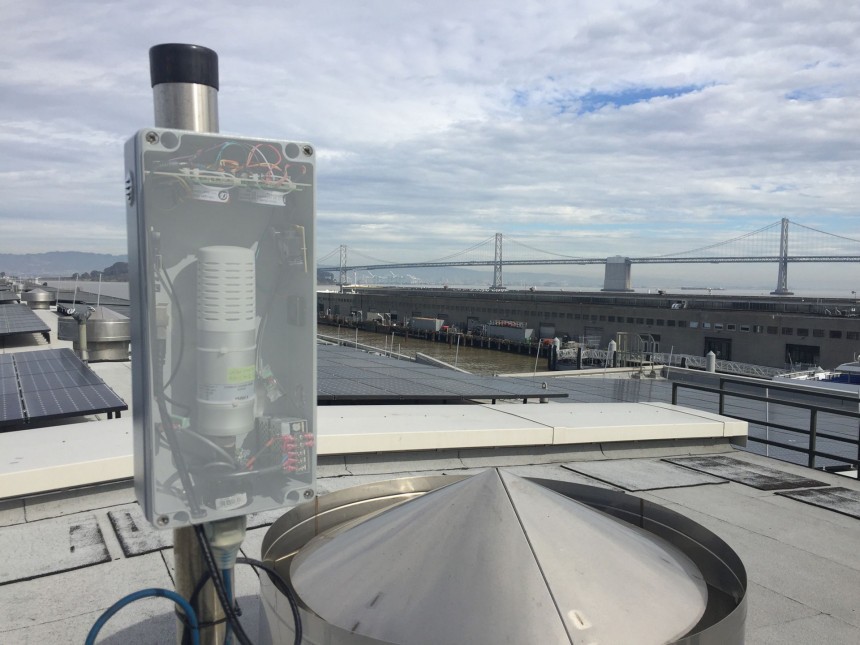
In 2012, more than a decade ago, he started setting up a monitoring network around the San Francisco Bay Area. This network now has 80 stations, and 57 sensors are part of the BEACO2N project (Berkeley Environmental Air Quality and CO2 Network).
But first, let me tell you something that blew my mind. We all know that many national and international agencies measure air pollution. But get this: while official reports estimate that urban areas are responsible for 70% of global CO2 emissions, no one can show exactly their source.
Or, in UC Berkley's scientific language, "few urban areas have granular data about where those emissions originate." Well, between you and me, I hated chemistry when I was in school. Nevertheless, chemistry experts can accurately measure any kind of chemical compound in the air, like they are some kind of SF wizards (it's plain science, though).
But, for some reason (I bet trumpist conspiracy fans will enjoy this), all those agencies spending huge budgets out of taxpayers' money can't quite figure out who exactly and how much pollution produces. That's why you only get some estimations and no clear pinpointing.
Hey, do you want to know what the cherry on top is? According to UC Berkley, EPA's pollution monitoring stations cost around $200,000 each, 20 times more than BEACO2N's sensors. Well, maybe they're much more expensive because they're much better, right? Aham, no.
Compared to EPA's sensors, UC Berkley's sensors can measure not only CO2 emissions but also five critical air pollutants: carbon monoxide, ozone, nitrous oxides (NO and NO2), and fine particulates PM2.5 (which rank very high on the World Health Organization's carcinogenic elements list).
In short, the 57 stations BEACO2N network "involves about half a million dollars' worth of equipment — a one-time investment — and a person per year thinking about it," Cohen said. If I do the math, the EPA could provide cities with only three CO2 monitoring stations for that money!
Listen to what else Cohen has to say: "One of our goals is to demonstrate, both on the CO2 and the air quality side of what we do, that this is cost-effective, translatable, and easily accessible to the public in a way that nothing else is."
Is it me, or does this sound too good to be true? Maybe it's just a marketing stunt from UC Berkley to try and sell their stuff. If this is the case, then the authorities from Los Angeles, California; Providence, Rhode Island; and Glasgow, Scotland, are kind of screwed because they "adopted Cohen's sensors to create their own pollution monitoring networks."
Or maybe they did the right thing because they really care about the net-zero climate goals and need to correctly identify pollution sources to take appropriate measures. This is where we get to the bottom of this article.
Of course, this scientifical explanation is out of my league, but I tend to trust science. On the other hand, the official "bottom-up" method is way too inaccurate: it estimates "how much gas is used in heating and, for vehicles, the fuel efficiency of registered vehicles in an area and overall fuel consumption."
Data from the BEACO2N network and researchers' approach to "translate" them helped to isolate road traffic emissions from home heating and cooking emissions and industry and refinery emissions.
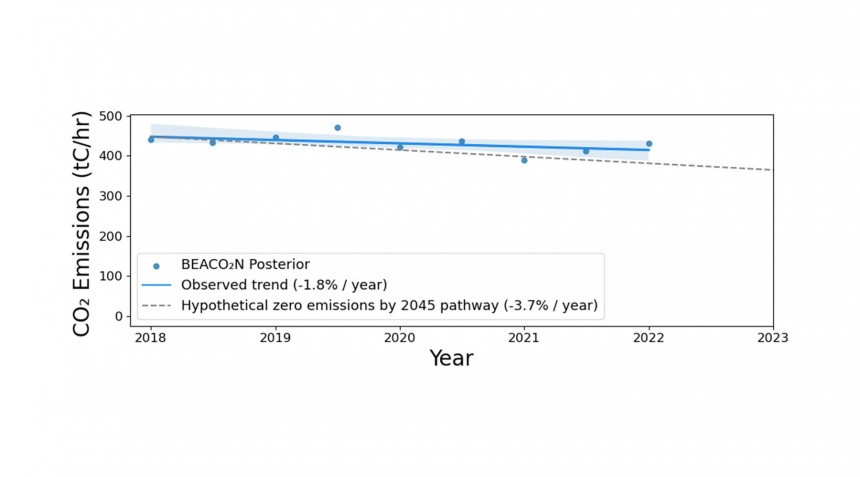
Researchers state that they found "a decreasing emissions trend of 1.8 ± 0.3%/year over the region from 2018 to 2022." This decreasing trend was more pronounced in the road transportation sector – about "2.6% less CO2 per mile driven each year."
So, in the five years between 2018 and 2022 (which also included the COVID-19 pandemic), car-related CO2 emissions decreased around 13%. In 2018, more than 160,000 plug-in vehicles were registered in California, while in 2022, their number almost doubled.
Considering that their market share grew from 7.6% to almost 20%, and the EV adoption is very high in the Bay Area, where the monitoring project occurred, this makes this study "the first evidence that the adoption of electric vehicles is measurably lowering the area's carbon emissions."
This is important because naysayers tend to minimize road traffic's share of emissions and usually blame other sources. It's easy to convince people when you can't accurately measure and identify the source of emissions. However, things will most likely change after UC Berkley's study findings.
Interestingly, EPA has only 7 monitoring stations in the Bay Area, and, according to UC Berkley, EPA's data couldn't provide evidence of this downward emissions trend. One of the direct benefits of the BEACO2N project is finding that "to meet California and Bay Area carbon reduction goals, the yearly decrease needs to be much greater."
Graduate student Naomi Asimow, in the Department of Earth and Planetary Science, concluded: "What we report is around half as fast as we need to go to get to net zero emissions by 2045." So, apart from the EVs' "intended effect on CO2 emissions," UC Berkley's study also warns policymakers that current laws must change.
In the end, I can only agree with the researchers' conclusion: "The optimal solution to […] monitor carbon dioxide levels across wide areas and with more granularity […] will be some combination of space-based assets and ground-based measurements."
However, the real question is whether this data will convince us that continuing to rely on fossil fuels will worsen things. After all, it's useless to have the means to show who is to blame if we don't take measures against the culprit. That being said, I look forward to seeing how the naysayers will "debunk" this UC Berkley study findings.
Yes, you can blame an EV for its battery-related pollution, although this is an overinflated subject. And yes, you can blame electricity for being sourced from power plants running on dirty coal. Still, as the share of renewables is only growing day by day, the electricity carbon footprint is shrinking over time.
In the end, the only reason for electric cars' demise because of pollution-related issues is the idea that you can't blame solely internal combustion cars for the amount of CO2 emissions and all those nasty chemical polluters because you can't separate ICE vehicles' emissions from other sources, like industry, agriculture, cement production, and so on.
Well, UC Berkley just proved all naysayers that they're wrong. Because chemistry is a b*tch – in a positive way, that is.
EPA: "Monitoring emissions is expensive." UC Berkley's Cohen: "Hold my beer"
Cohen – where did I head that name? Of course, it was the singer and songwriter Leonard Cohen who made some impact in Western culture thanks to some of his best-known hits, like "Dance Me to the End of Love."
Unfortunately, Ronald Cohen will most likely remain in the shadows, although he deserves a movie like Oppenheimer. That's because Ronald Cohen, a UC Berkley chemistry professor, may have found a way for society (and honest politicians) to fight back against Big Oil's propaganda.
In 2012, more than a decade ago, he started setting up a monitoring network around the San Francisco Bay Area. This network now has 80 stations, and 57 sensors are part of the BEACO2N project (Berkeley Environmental Air Quality and CO2 Network).
Or, in UC Berkley's scientific language, "few urban areas have granular data about where those emissions originate." Well, between you and me, I hated chemistry when I was in school. Nevertheless, chemistry experts can accurately measure any kind of chemical compound in the air, like they are some kind of SF wizards (it's plain science, though).
But, for some reason (I bet trumpist conspiracy fans will enjoy this), all those agencies spending huge budgets out of taxpayers' money can't quite figure out who exactly and how much pollution produces. That's why you only get some estimations and no clear pinpointing.
Hey, do you want to know what the cherry on top is? According to UC Berkley, EPA's pollution monitoring stations cost around $200,000 each, 20 times more than BEACO2N's sensors. Well, maybe they're much more expensive because they're much better, right? Aham, no.
Compared to EPA's sensors, UC Berkley's sensors can measure not only CO2 emissions but also five critical air pollutants: carbon monoxide, ozone, nitrous oxides (NO and NO2), and fine particulates PM2.5 (which rank very high on the World Health Organization's carcinogenic elements list).
In short, the 57 stations BEACO2N network "involves about half a million dollars' worth of equipment — a one-time investment — and a person per year thinking about it," Cohen said. If I do the math, the EPA could provide cities with only three CO2 monitoring stations for that money!
Is it me, or does this sound too good to be true? Maybe it's just a marketing stunt from UC Berkley to try and sell their stuff. If this is the case, then the authorities from Los Angeles, California; Providence, Rhode Island; and Glasgow, Scotland, are kind of screwed because they "adopted Cohen's sensors to create their own pollution monitoring networks."
Or maybe they did the right thing because they really care about the net-zero climate goals and need to correctly identify pollution sources to take appropriate measures. This is where we get to the bottom of this article.
A small downward trend for EVs, but a big gain for monitoring emissions
According to UC Berkley's study, data shows that the vehicle emissions rates dropped 2.6% yearly. This resulted from combining "direct CO2 measurements with meteorological data to calculate ground-level emissions." Researchers also "employed a Bayesian statistical analysis" and revised the economic data from the "bottom-up" method "to predict where the emissions originated."Of course, this scientifical explanation is out of my league, but I tend to trust science. On the other hand, the official "bottom-up" method is way too inaccurate: it estimates "how much gas is used in heating and, for vehicles, the fuel efficiency of registered vehicles in an area and overall fuel consumption."
Data from the BEACO2N network and researchers' approach to "translate" them helped to isolate road traffic emissions from home heating and cooking emissions and industry and refinery emissions.
Researchers state that they found "a decreasing emissions trend of 1.8 ± 0.3%/year over the region from 2018 to 2022." This decreasing trend was more pronounced in the road transportation sector – about "2.6% less CO2 per mile driven each year."
Considering that their market share grew from 7.6% to almost 20%, and the EV adoption is very high in the Bay Area, where the monitoring project occurred, this makes this study "the first evidence that the adoption of electric vehicles is measurably lowering the area's carbon emissions."
This is important because naysayers tend to minimize road traffic's share of emissions and usually blame other sources. It's easy to convince people when you can't accurately measure and identify the source of emissions. However, things will most likely change after UC Berkley's study findings.
Interestingly, EPA has only 7 monitoring stations in the Bay Area, and, according to UC Berkley, EPA's data couldn't provide evidence of this downward emissions trend. One of the direct benefits of the BEACO2N project is finding that "to meet California and Bay Area carbon reduction goals, the yearly decrease needs to be much greater."
Graduate student Naomi Asimow, in the Department of Earth and Planetary Science, concluded: "What we report is around half as fast as we need to go to get to net zero emissions by 2045." So, apart from the EVs' "intended effect on CO2 emissions," UC Berkley's study also warns policymakers that current laws must change.
In the end, I can only agree with the researchers' conclusion: "The optimal solution to […] monitor carbon dioxide levels across wide areas and with more granularity […] will be some combination of space-based assets and ground-based measurements."
However, the real question is whether this data will convince us that continuing to rely on fossil fuels will worsen things. After all, it's useless to have the means to show who is to blame if we don't take measures against the culprit. That being said, I look forward to seeing how the naysayers will "debunk" this UC Berkley study findings.
