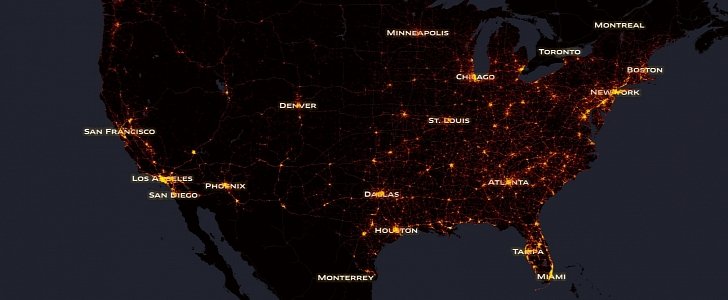
The cold hard traffic fatalities numbers aren’t enough to make us realize the severity of the situation. Sometimes, it takes a graphic visualization to really get an idea of the scale of this phenomenon.
That’s exactly what data scientist Max Galka thought when he decided to spend a few weeks collecting information from millions of records from the US government’s Fatality Analysis Reporting System and compiling them all in an interactive map.
A number is just a number, you don’t relate to it in any way unless someone you know was recently involved in a traffic accident - then, it becomes relevant. To the rest of the lucky ones, however, the numbers are just some unfortunate statistics that have nothing to do with them. It’s the government’s business to deal with it, after all.
Well, an icon on a map seems just as impersonal at first. Until you zoom in really close and notice it’s placed right on your street. That’s right, sometime in the past ten years, a pedestrian was run over and killed by a DUI driver just a few yards from where you live. And further down the street you so often ride your bike on, a cyclist was fatally injured by a distracted driver. Not so impersonal anymore, right?
Apart from a pretty exact location, the map also lets you see a lot of useful information, such as the type of victim (pedestrian, cyclist, driver, passenger, multiple) and what caused the accident (distracted driver, speeding, or alcohol).
Zooming as far out as possible will clearly show that the Eastern half of the country has a considerable (and rather dark) head start in front of the rest of the territory, amassing most of the 373,377 casualties registered between 2003 and 2014. The only other region that comes close is the state of California - of course, the numbers are closely related to the population density in each area.
On the other hand, none of the three tracked causes (alcohol, distraction, and speeding) seems to have the upper hand, so they all need to be tackled with equal urgency by the authorities.
It won’t be an easy lecture, but it might be a useful one. Next time you might think about driving after “just one tiny glass” or about speeding because “there’s no police here,” remember this black map of the USA and try not to add any more color to it.

