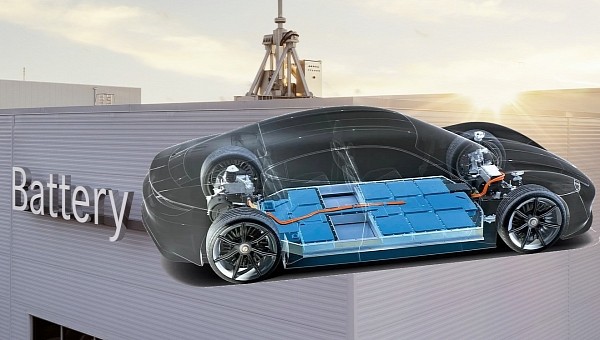
According to DOE, North America’s battery capacity in 2030 will likely support the manufacturing of up to 13 million electric vehicles per year. It’s almost the same number as all vehicle sales in the U.S. in 2022. There are other bits of info to the great picture.
Sometimes, it feels like we’re living in two different worlds at the same time.
In one of them, there are all those people who think EVs are rubbish. They spread all kinds of fake news, alternative facts, or out-of-context information about the dark side of electromobility. And they see oil as the only solution for their cars and their needs, at this very moment.
In the other world, there are these people who speak about pollution and climate change, based on scientific facts. They warn others about mid- and long-term problems and analyze technological improvements and alternatives to the current polluting ones.
Then there are all the others, who live in both worlds and are very confused about who is right and what is wrong. They sort of want an electric car, but they are not willing to make compromises about the range, charging time, or price of the car.
It's something like “we know we have to change things, but we don’t really want that change.” We like it as it is. But remember what Darwin said: “The fittest survives.” When things you’re used to are changing – very fast and very dramatically – you are forced to give up your comfort zone and reassess things.
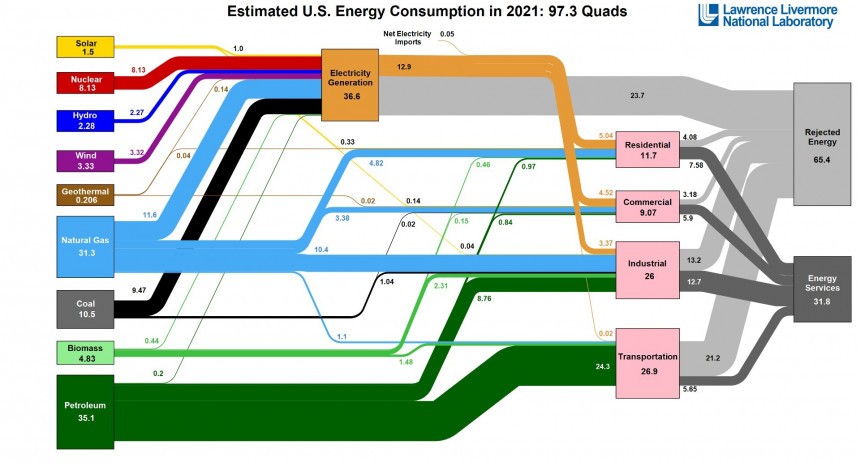
Let’s take a look at the estimated U.S. energy consumption habits in 2021, thanks to the flow diagram created by Lawrence Livermore National Laboratory. Data for 2022 is not available yet, but we’re only exercising, for now, to get to a point.
By the way, all the values in this graph are in quads – quadrillions of British thermal units (BTUs). It’s something to define and quantify the energy we use, no matter what its source. At this point, you’re probably dazzled like Denzel Washington in “Philadelphia,” but don’t worry, there’s no need to “explain this to me like I’m a 4-year-old.”
You have all those colors and rectangles of different sizes to easily understand the bigger picture. We use many sources of energy (column on the left) for different activities (pink rectangles). In the end, we can measure the efficiency of using all that energy (those two gray rectangles on the right).
Ok, my almost-4-years-old daughter still doesn’t get it, but she doesn’t know how to read either. While you do, and I’m sure you know what efficiency is all about. As you can see, in 2021, the U.S. wasted two-thirds of the energy it used. Rejected energy rectangle is two times larger than the energy services.
How does it translate to YOUR reality? You’re paying three times more than you should on the gasoline for your car, on the electricity bill for your stuff, and on your gas bill for your house. It sounds crazy, but this is how things are done now. Inefficiently.
It means that two-thirds were lost because of the inefficient use of fossil fuels. If we were to replace all fossil fuel sources with non-fossil, such as renewables, that gray lane (wasted energy) would be nothing more but a very thin thread.
Ok, now look at that pink Transportation rectangle: 24.3 quads (90%) are coming from petroleum, some 2.58 quads (less than 10%) from biomass and natural gas, and only 0.02 quads (less than 0,1%) are coming from electricity.
Of the 26.9 quads used by the transportation sector, 21.2 are wasted. Wait, that’s not two-thirds. It’s actually more than three-quarters! As you can see, transport is by far the most inefficient in this chart compared to the other three pink sectors and even the orange electricity generation.
Almost 80% of the energy needed (most of it from petroleum fuels) is wasted. And, may I add, it also creates pollution and GHG emissions, which are not accounted for in the chart. Oh, I just realized I made a mistake earlier: you’re not paying three times more at the pump, but four times more.
That’s because internal combustion engines’ efficiency is really awful compared to electric motors. So it’s only logical to replace them with electric ones. This way, we’ll see a huge improvement in the transportation sector’s overall efficiency.
Economically speaking, the transportation sector must improve its efficiency at a fast pace. Regardless of the pollution collateral damage. It’s too expensive and not sustainable at all for all forms of transport to continue relying on oil.
That’s why, by the end of this decade, we’ll witness a wave of new planned electric vehicle battery plants all over the North American continent. The U.S. Department of Energy and Argonne National Laboratory compiled data from several sources and companies, and at this point, there are almost 100 projects in the pipeline.
Most battery plant projects are scheduled to be operational between 2025 and 2030. Total manufacturing capacity is estimated to increase from 55 GWh/year in 2021 to 998 GWh/year in 2030. It’s a 20-fold increase in capacity in only eight years.
And it’s rather a conservative estimate, based on current technologies for batteries and EVs projected demand. But, as recent years have shown, things could go terribly wrong (we still have to face global turmoil because of Russia’s war on Ukraine). Or they could be accelerated by technological breakthroughs.
DOE was able to create a map of battery plant sites for the whole continent. It looks like 55 of them are in the U.S., most of them concentrated along a north-south band from Michigan to Alabama. Expect the highest growth in battery manufacturing capacity to be in Kentucky, Tennessee, Georgia, and Michigan.
It may come as a surprise, but Mexico will host 30 battery plants, while Canada only has nine. There’s also a strong correlation with vehicle assembly locations for better optimization of supply chains and logistics. Once again, efficiency is the key.
So it’s only natural to assume that the vast majority of new cars sold by the end of the decade will be electric cars. Yes, you are right to doubt that, given that there are less than five million EVs on U.S. roads right now. But you are also so wrong.
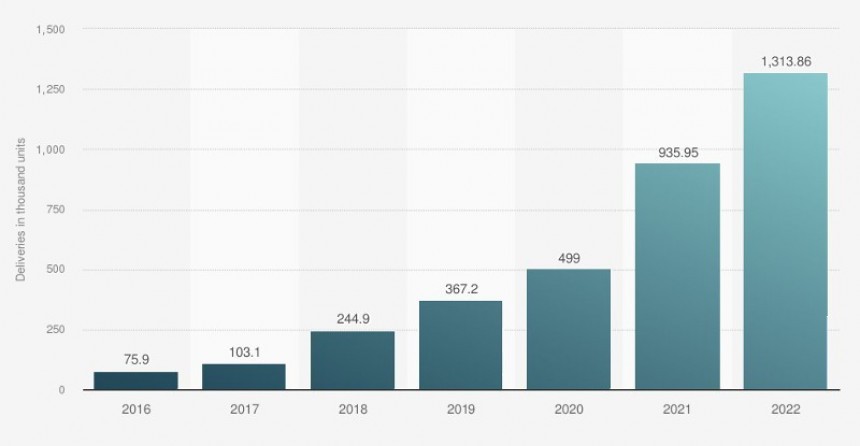
Tesla is probably an exaggerated best example for ramping up production and sales. In 2022, they built 1.37 million cars, which is a 47% Year-on-Year growth. And it’s also a more-than-three-times increase compared to 2019.
But, hey, they started all this “electrify everything” frenzy. And now all the legacy automakers – and I mean ALL of them – are into electrification. A recent report from BloombergNEF stated that over half of passenger cars sold in the U.S. will be electric in 2030 thanks to the Biden administration’s $374 billion program.
The very same BloombergNEF is showing in another report that the lithium-ion battery price has fallen from $732/kWh in 2013 to roughly $141/kWh in 2021. It raised to $151/kWh in 2022, because of the war context, but it is expected to further go down. By 2030, it is expected to slide under the milestone of $100/kWh.
There are other factors to take into consideration, but one of them is simply outstanding: phasing out of internal combustion engines. California, Washington, and Massachusetts are the pioneers in the U.S., but by 2030, analysts expect at least two-thirds of states to follow suit and establish 2035 or 2040 as the phase-out year.
Let’s get back to that flow diagram we discussed earlier. And keep in mind that the efficiency of non-fossil (like nuclear) and renewable sources is much better than that of fossil fuels. So, using only electricity would diminish the waste from two-thirds to a mere 10% (worst-case scenario).
The Energy Services dark grey rectangle is almost 32 quads, so the four pink rectangles would need roughly 35-36 quads of electricity. It means the Electricity Generation orange rectangle needs around 40 quads of energy source. Which is less than half of the 97 quads needed, according to the chart.
In other words, we need fewer non-fossil fuel sources than the fossil fuel sources we use today to satisfy our increasing hunger for energy. And in the process, we get rid of the pollution and its collateral damage. Which adds too much to overall costs.
Bottom line: there’s no need for a crystal globe to make predictions for 2030 in the car industry. You only need to pay attention to industry data and trends. And a spoon of logical thinking.
In one of them, there are all those people who think EVs are rubbish. They spread all kinds of fake news, alternative facts, or out-of-context information about the dark side of electromobility. And they see oil as the only solution for their cars and their needs, at this very moment.
In the other world, there are these people who speak about pollution and climate change, based on scientific facts. They warn others about mid- and long-term problems and analyze technological improvements and alternatives to the current polluting ones.
Then there are all the others, who live in both worlds and are very confused about who is right and what is wrong. They sort of want an electric car, but they are not willing to make compromises about the range, charging time, or price of the car.
It's something like “we know we have to change things, but we don’t really want that change.” We like it as it is. But remember what Darwin said: “The fittest survives.” When things you’re used to are changing – very fast and very dramatically – you are forced to give up your comfort zone and reassess things.
Ask if your reality is the real reality
Don’t be confused about it. Your OWN reality is just a small, even insignificant part, of the broader reality. What and how you consume, as a person, is irrelevant compared to what all the people in the country do.Let’s take a look at the estimated U.S. energy consumption habits in 2021, thanks to the flow diagram created by Lawrence Livermore National Laboratory. Data for 2022 is not available yet, but we’re only exercising, for now, to get to a point.
By the way, all the values in this graph are in quads – quadrillions of British thermal units (BTUs). It’s something to define and quantify the energy we use, no matter what its source. At this point, you’re probably dazzled like Denzel Washington in “Philadelphia,” but don’t worry, there’s no need to “explain this to me like I’m a 4-year-old.”
Ok, my almost-4-years-old daughter still doesn’t get it, but she doesn’t know how to read either. While you do, and I’m sure you know what efficiency is all about. As you can see, in 2021, the U.S. wasted two-thirds of the energy it used. Rejected energy rectangle is two times larger than the energy services.
How does it translate to YOUR reality? You’re paying three times more than you should on the gasoline for your car, on the electricity bill for your stuff, and on your gas bill for your house. It sounds crazy, but this is how things are done now. Inefficiently.
Transport is more efficient through electrification
Look at that orange Electricity Generation rectangle. It needed 36.6 quads, and 58% was sourced from fossil fuels like natural gas, coal, and petroleum. Then look at the efficiency: 12.9 quads were put to good use, while 23.7 quads were lost.It means that two-thirds were lost because of the inefficient use of fossil fuels. If we were to replace all fossil fuel sources with non-fossil, such as renewables, that gray lane (wasted energy) would be nothing more but a very thin thread.
Ok, now look at that pink Transportation rectangle: 24.3 quads (90%) are coming from petroleum, some 2.58 quads (less than 10%) from biomass and natural gas, and only 0.02 quads (less than 0,1%) are coming from electricity.
Of the 26.9 quads used by the transportation sector, 21.2 are wasted. Wait, that’s not two-thirds. It’s actually more than three-quarters! As you can see, transport is by far the most inefficient in this chart compared to the other three pink sectors and even the orange electricity generation.
Almost 80% of the energy needed (most of it from petroleum fuels) is wasted. And, may I add, it also creates pollution and GHG emissions, which are not accounted for in the chart. Oh, I just realized I made a mistake earlier: you’re not paying three times more at the pump, but four times more.
That’s because internal combustion engines’ efficiency is really awful compared to electric motors. So it’s only logical to replace them with electric ones. This way, we’ll see a huge improvement in the transportation sector’s overall efficiency.
Batteries, batteries, and more batteries
YOUR reality should revolve around this efficiency thing because efficiency is equivalent to equilibrium in every aspect of our lives. But let’s not get into life hacks now and let’s go back to the bigger picture.Economically speaking, the transportation sector must improve its efficiency at a fast pace. Regardless of the pollution collateral damage. It’s too expensive and not sustainable at all for all forms of transport to continue relying on oil.
That’s why, by the end of this decade, we’ll witness a wave of new planned electric vehicle battery plants all over the North American continent. The U.S. Department of Energy and Argonne National Laboratory compiled data from several sources and companies, and at this point, there are almost 100 projects in the pipeline.
And it’s rather a conservative estimate, based on current technologies for batteries and EVs projected demand. But, as recent years have shown, things could go terribly wrong (we still have to face global turmoil because of Russia’s war on Ukraine). Or they could be accelerated by technological breakthroughs.
DOE was able to create a map of battery plant sites for the whole continent. It looks like 55 of them are in the U.S., most of them concentrated along a north-south band from Michigan to Alabama. Expect the highest growth in battery manufacturing capacity to be in Kentucky, Tennessee, Georgia, and Michigan.
It may come as a surprise, but Mexico will host 30 battery plants, while Canada only has nine. There’s also a strong correlation with vehicle assembly locations for better optimization of supply chains and logistics. Once again, efficiency is the key.
Time to say goodbye to ICEs
The projected production capacity of almost 1,000 GWh/year is estimated to support the manufacturing of ten to 13 million EVs per year. Keep in mind that U.S. vehicle sales peaked in 2016 at roughly 17.5 million units. It has only declined ever since, and 2022 is likely to count less than 14 million vehicles.So it’s only natural to assume that the vast majority of new cars sold by the end of the decade will be electric cars. Yes, you are right to doubt that, given that there are less than five million EVs on U.S. roads right now. But you are also so wrong.
Tesla is probably an exaggerated best example for ramping up production and sales. In 2022, they built 1.37 million cars, which is a 47% Year-on-Year growth. And it’s also a more-than-three-times increase compared to 2019.
The very same BloombergNEF is showing in another report that the lithium-ion battery price has fallen from $732/kWh in 2013 to roughly $141/kWh in 2021. It raised to $151/kWh in 2022, because of the war context, but it is expected to further go down. By 2030, it is expected to slide under the milestone of $100/kWh.
There are other factors to take into consideration, but one of them is simply outstanding: phasing out of internal combustion engines. California, Washington, and Massachusetts are the pioneers in the U.S., but by 2030, analysts expect at least two-thirds of states to follow suit and establish 2035 or 2040 as the phase-out year.
More electricity, please!
There’s a real concern about how much electricity is needed for so many electric cars. Indeed, the U.S. would need to produce 20-30%, or even 50% more electricity for all EVs in 2030. But it isn’t as bad as it sounds.Let’s get back to that flow diagram we discussed earlier. And keep in mind that the efficiency of non-fossil (like nuclear) and renewable sources is much better than that of fossil fuels. So, using only electricity would diminish the waste from two-thirds to a mere 10% (worst-case scenario).
The Energy Services dark grey rectangle is almost 32 quads, so the four pink rectangles would need roughly 35-36 quads of electricity. It means the Electricity Generation orange rectangle needs around 40 quads of energy source. Which is less than half of the 97 quads needed, according to the chart.
In other words, we need fewer non-fossil fuel sources than the fossil fuel sources we use today to satisfy our increasing hunger for energy. And in the process, we get rid of the pollution and its collateral damage. Which adds too much to overall costs.
Bottom line: there’s no need for a crystal globe to make predictions for 2030 in the car industry. You only need to pay attention to industry data and trends. And a spoon of logical thinking.


